Control Architect Help Documentation
×
Menu
Index

DataView Ribbon menu bar

DataView Ribbon menu bar
1

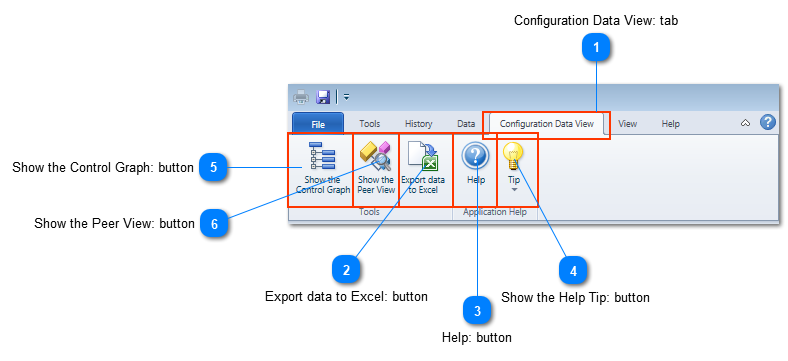
Configuration Data View: tab

1. Configuration Data View: tab
This Ribbon Toolbar tab contains the tool functions for the Data View.  This Ribbon Toolbar is automatically displayed when the "Data View" tab of the active configuration view is focused.
2

Export data to Excel: button

2. Export data to Excel: button
Click this button to export Control Module data to Excel using the Export Wizard.
3

Help: button

3. Help: button
Click this button to view the application Help topic for the "Data View".
4

Show the Help Tip: button

4.  Show the Help Tip: button
Click this button to view quick help tips for the "Data View".
5

Show the Control Graph: button

5. Show the Control Graph: button
Click this button to toggle open/closed the Control Graph View for the selected Control Module items in the List View.  The Control Graph will show relationships between Control Modules.
6

Show the Peer View: button

6. Show the Peer View: button
Click this button to toggle open/closed the Peer Graph View for the Configuration Asset Model (Project).  This Peer View will show all Peer-to-Peer relationships between nodes that are contained in this Configuration Asset Model (Project).
7

Refresh Data: button

7. Refresh Data: button
Click this button to reload the Configuration Asset model.
8

Print Chart Views: button

8. Print Chart Views: button
Click this button to batch print the Chart Views for the selected Data View Entity items.
9

Open PLC Asset: drop-down button

9. Open PLC Asset: drop-down button
Click this drop-down button to view any PLC configuration assets associated with the current Configuration snapshot.
10

Generate Report: menu

10. Generate Report: menu
Click this drop-down button to access the various report types.
11

Alarm Analysis Report: menu

11. Alarm Analysis Report: menu
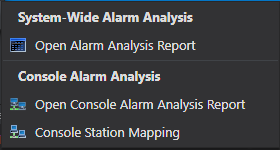
Click a menu item to generate and view Alarm Analysis summaries for both System-Wide and Operator Consoles.