Using the PKS Control Graph
Using the Control Graph
The Control Graph provides various visual cues that help to quickly identify potential anomalies and data relationships between Control Strategies that are difficult to find using other analysis methods. The following graphical images are used to identify how these visual cues are presented when viewing Configuration Asset Model data within Control Architect.
Displaying a Control Graph
The PKS CM Views function provides several view types for viewing PKS Cxxx Control Strategy configuration. The Data View tab provides a listing of all entities exported from an Experion Server that have been parsed into a Configuration Asset data Model. To view a Control Graph select an entity(s) from the list and left mouse-click the button in the top right area of the tab view to analyze the data relationships for the selected Control Module items and present a Control Graph of the analysis results.
Hint: Hover the mouse over button targets to view their ToolTips that provide a description of their actions.
Visualizing Control Strategies
You can keep the Control Graph view open while scrolling through the list of entities listed in the DataView tab. Each time a new selection is detected, the Control Graph view will be automatically updated with the current connection relationship analysis.
You can also multiple select entities from the list in the DataView tab and view their combined connection relationships analysis.
Changing the Layout
Use mouse-wheel to zoom in/out and hold the left mouse-click and drag to pan the view.
Vertices (Blocks) can be dragged and moved to adjust their position in the graph along with their attached edges (connections).
You can keep pressed the Alt key while dragging with the left mouse cursor to select a group of blocks to zoom to and fill the view.
Control Graph References
Navigating to a Block ChartView
You can left mouse button double-click on a block to navigate to the ChartView for the clicked Control Module.
Working with the Block Adorner
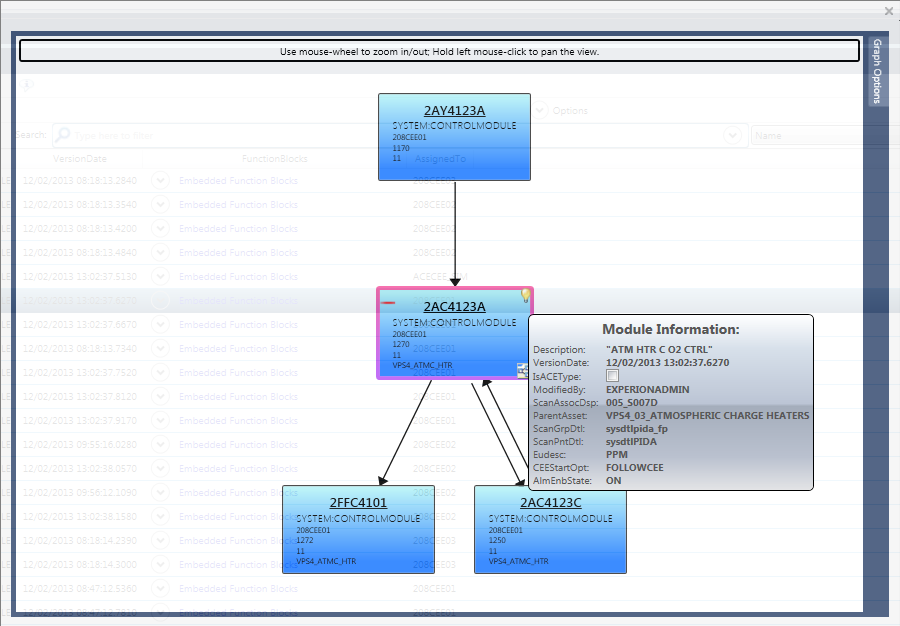
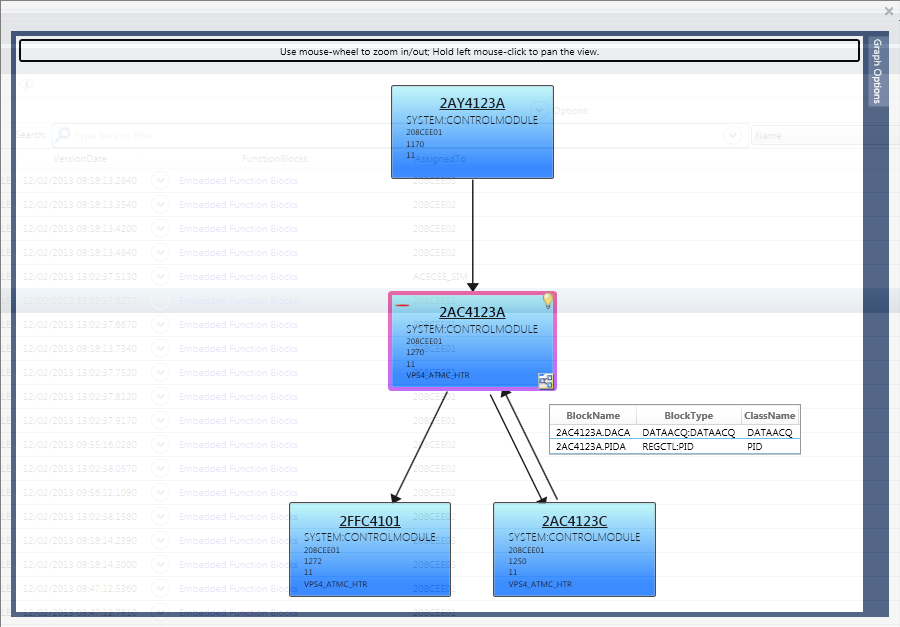
The following image show an adorner that is presented when the mouse cursor is hovered over a block that represents a Control Module in the Control Graph. The adorner provides visual cues such as image targets that when hovered over with the mouse will present more data associated with the particular Control Module block such as common parameter data values, list of external connection references, and a list of embedded function blocks. The adorner also provides an expand/collapse button that allows you to delve deeper into the connection relationships for the particular module. The magenta border around the Control Module block 2AC4123A indicates that this was the source of the analysis and it is currently expanded showing all immediate connection relationships to itself.


Blocks relationships can be further expanded and collapsed by clicking the button located in the top left corner of the block. When blocks are expanded to show their immediate connection relationships the border color of the block will change to the magenta color to indicate that it is a source of connection relationship analysis.
The image below shows a connection ToolTip that is displayed when a connection edge is hovered over with the mouse. When a connection edge is hovered over using the mouse cursor, the blocks that are the source and target of the connection will become highlighted along with the connection line.
The image below shows a ToolTip that displays a list of external connection references when the mouse is hovered over the bottom left adorner image. Notice the image in the top left location of the adorner that indicates that this block can be delved (expanded) into to show its immediate external connected Control Module blocks.
The image below shows a ToolTip that is displayed when the mouse cursor is hovered over the value 362, which indicates that this value represents the OrderInCEE parameter. Hovering the mouse cursor over the item values displayed in a block will provide a brief description of the value or in the case of the Control Module name its ToolTip will display the Description parameter value for the Control Module.