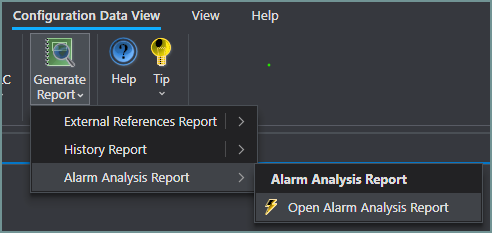
The Alarm Analysis Report is generated from the currently active MongoDB asset collection. The generator reads every alarm block configuration from that collection, accumulates fleet-wide and per-template counts, and writes a multi-worksheet Excel workbook which is then saved to MongoDB GridFS for later retrieval.
Before You Begin
Confirm that the correct Asset Collection is selected in Control Architect.
Review Report Options (expand the Report Options & Additional Columns section at the bottom of the view) to configure custom parameters and display preferences before generating.
1. Open the Alarm Analysis Report view in Control Architect.
2. Click the Generate Report button.
3. A progress indicator displays the current entity being processed and an overall percentage. Generation time depends on collection size; large collections (thousands of entities) typically complete in under a minute.
4. When complete, the in-app spreadsheet viewer shows the Alarm Summary worksheet by default.
5. The report is automatically saved to MongoDB GridFS in the background so it can be reloaded in a future session without regenerating.
Tip — Snapshot Each generation saves a point-in-time snapshot of the fleet's alarm priority and state counts to MongoDB. These snapshots are used to calculate trend indicators (↑ improved / ↓ worsened / → no change) the next time a report is generated or loaded. See Trend Analysis and Snapshots.
What Happens During Generation
For each entity in the collection the generator:
1. Reads all embedded alarm blocks from the entity's XML configuration.
2. Writes one Tag Data row per alarm block that carries at least one alarm parameter value.
3. Accumulates fleet-wide counts for alarm type, priority (EMERGNCY / URGENT / HIGH / LOW / JOURNAL / NOACTION / NONE) and alarm state (Enable / Disable / Inhibit).
4. Accumulates the same priority and state counts per TemplateName for the Template Breakdown worksheet.
5. Optionally highlights Tag Data rows where any alarm parameter resolves to NOACTION or NONE (see Highlight NOACTION / NONE rows).
Reloading a Previously Generated Report
If a report has already been generated for the active collection it can be reloaded without reprocessing the entire collection:
1. Click Load Report.
2. The workbook stored in MongoDB GridFS is downloaded and displayed in the in-app viewer.
3. The Alarm Summary worksheet is always shown as the active tab on load.
Note The in-app spreadsheet viewer shows the Alarm Summary, ISA-18.2 KPIs, Template Breakdown and Tpl Breakdown — Legend worksheets. The Tag Data worksheet is intentionally excluded from the in-app view for performance reasons; it is available in the exported Excel file only.