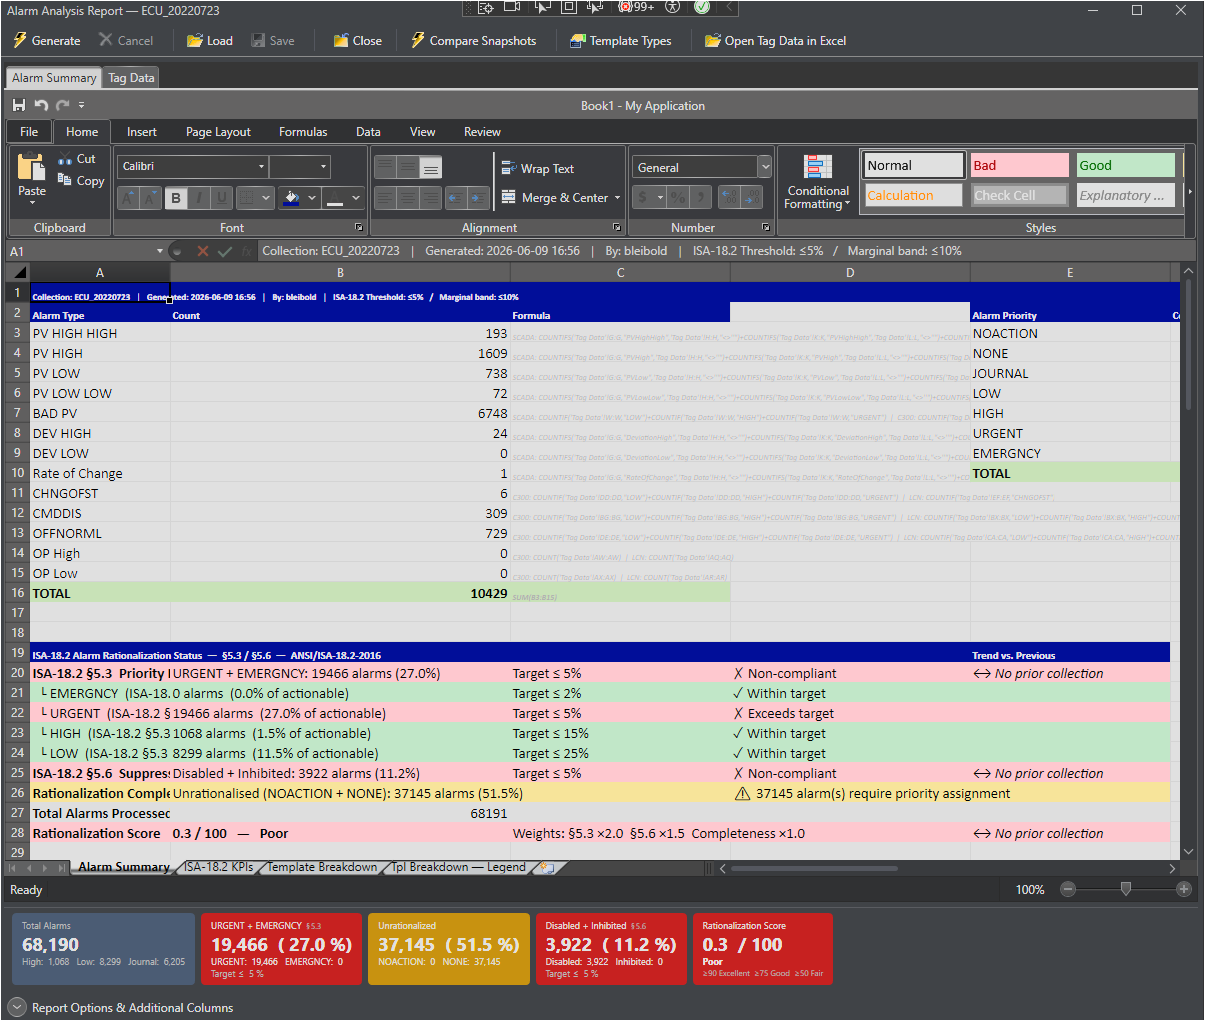
The Alarm Summary worksheet is the primary overview sheet. It is always the active tab when a report is opened or loaded. It presents fleet-wide alarm counts and the full ISA-18.2 compliance status in a single screen without requiring a scroll.
Layout
The worksheet contains four side-by-side summary tables followed by the ISA-18.2 compliance section:
Table
Columns
Content
Alarm Type
A – C
One row per alarm category (PV HIGH HIGH, PV HIGH, DEV HIGH, Rate of Change, etc.) with the programmatic count and the equivalent COUNTIF formula for verification in Excel.
Alarm Priority
E – G
One row per ISA-18.2 priority level (NOACTION, NONE, JOURNAL, LOW, HIGH, URGENT, EMERGNCY) with count and formula. NOACTION and NONE are excluded from the Totals row as they are unrationalized priorities, not actionable alarms.
Alarm State
I – K
Enable, Disable and Inhibit counts with the equivalent COUNTIF formula.
Alarm Type 1
M – Q
Extended per-parameter alarm type reference covering SCADA, C300 and LCN block types with system, alarm category and valid priority values documented for each parameter.
ISA-18.2 Compliance Section
Placed below the four summary tables, this section mirrors the ISA-18.2 KPIs worksheet content directly on the Alarm Summary tab for quick access without tab switching.
Row
Description
§5.3 Priority Fleet Compliance
URGENT + EMERGNCY count and Critical% versus the ISA compliance threshold. Color-coded green / amber / red. Includes a trend indicator versus the previous collection snapshot.
§5.3 Distribution — EMERGNCY
EMERGNCY count as % of actionable alarms versus the ISA-18.2 §5.3 distribution target (≤ 1%).
§5.3 Distribution — URGENT
URGENT count as % of actionable alarms versus distribution target (≤ 5%).
§5.3 Distribution — HIGH
HIGH count as % of actionable alarms versus distribution target (≤ 15%).
§5.3 Distribution — LOW
LOW count as % of actionable alarms versus distribution target (≤ 80%).
§5.6 Suppression Fleet Compliance
Disabled + Inhibited count and Suppressed% versus the ISA compliance threshold. Color-coded green / amber / red. Includes trend indicator.
Rationalization Completeness
Count of alarms with priority NOACTION or NONE that still require a rationalized priority assignment.
Total Alarms Processed
Total alarm block rows written to the Tag Data worksheet.
Rationalization Score
Composite 0–100 score. Green ≥ 90 (Excellent), Amber ≥ 75 (Good), Red < 75. Includes trend indicator and weight breakdown.
Trend Indicators
Where a previous collection snapshot exists, each compliance row displays a trend cell:
↑ +x.x% (improved) — metric moved in the correct direction.
↓ −x.x% (worsened) — metric deteriorated.
→ no change — delta smaller than 0.1% (treated as stable).
Trend cells are colored green for improvement and red for deterioration. A delta of less than 0.1% in either direction is treated as no change.
Note Trend comparison uses the most recent snapshot from any other collection in the same logical database — not the current collection — because each collection represents a distinct point-in-time export. See Trend Analysis and Snapshots for details.