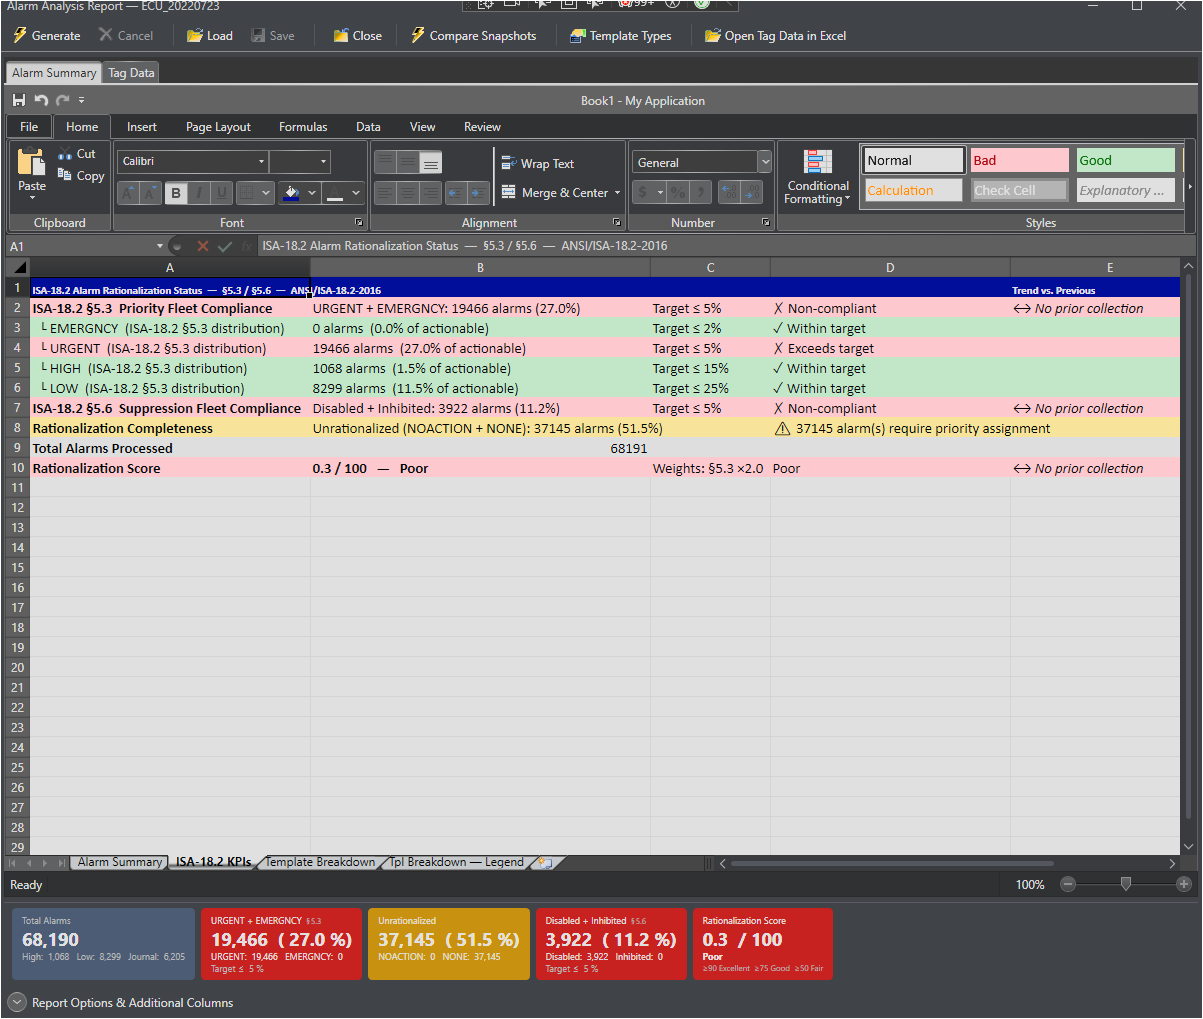
The ISA-18.2 KPIs worksheet provides a structured, self-contained compliance summary suitable for management reporting and quality review. It duplicates the ISA compliance section from the Alarm Summary worksheet but also includes an embedded PNG image of the rationalization summary panel when the report is exported to Excel.
Worksheet Rows
Row
ISA-18.2 Reference
Description
§5.3 Priority Fleet Compliance
§5.3
URGENT + EMERGNCY as Critical% of total actionable alarms versus the site threshold. Color-coded green / amber / red. Trend indicator versus previous snapshot.
└ EMERGNCY distribution
§5.3
EMERGNCY as % of actionable alarms. ISA-18.2 recommended upper limit: 1%.
└ URGENT distribution
§5.3
URGENT as % of actionable alarms. ISA-18.2 recommended upper limit: 5%.
└ HIGH distribution
§5.3
HIGH as % of actionable alarms. ISA-18.2 recommended upper limit: 15%.
└ LOW distribution
§5.3
LOW as % of actionable alarms. ISA-18.2 recommended upper limit: 80%.
§5.6 Suppression Fleet Compliance
§5.6
Disabled + Inhibited as Suppressed% of total state alarms versus the site threshold. Color-coded. Trend indicator versus previous snapshot.
Rationalization Completeness
§4.3
Count of alarms with priority NOACTION or NONE (unrationalized). Green when fully rationalized; amber when any unrationalized alarms remain.
Total Alarms Processed
—
Total alarm block rows written to Tag Data.
Rationalization Score
§4.3
Composite 0–100 score. Weight breakdown displayed in the formula column. Trend indicator versus previous snapshot. Color-coded green ≥ 90, amber ≥ 75, red < 75.
When a report is exported to Excel using the Export to Excel button, a PNG snapshot of the rationalization summary panel from the Control Architect UI is embedded as a floating image below the KPI data rows. This gives the exported workbook a visual summary alongside the structured data, suitable for inclusion in management reports.
Note The embedded image is added only at export time. It does not appear in the in-app spreadsheet viewer.