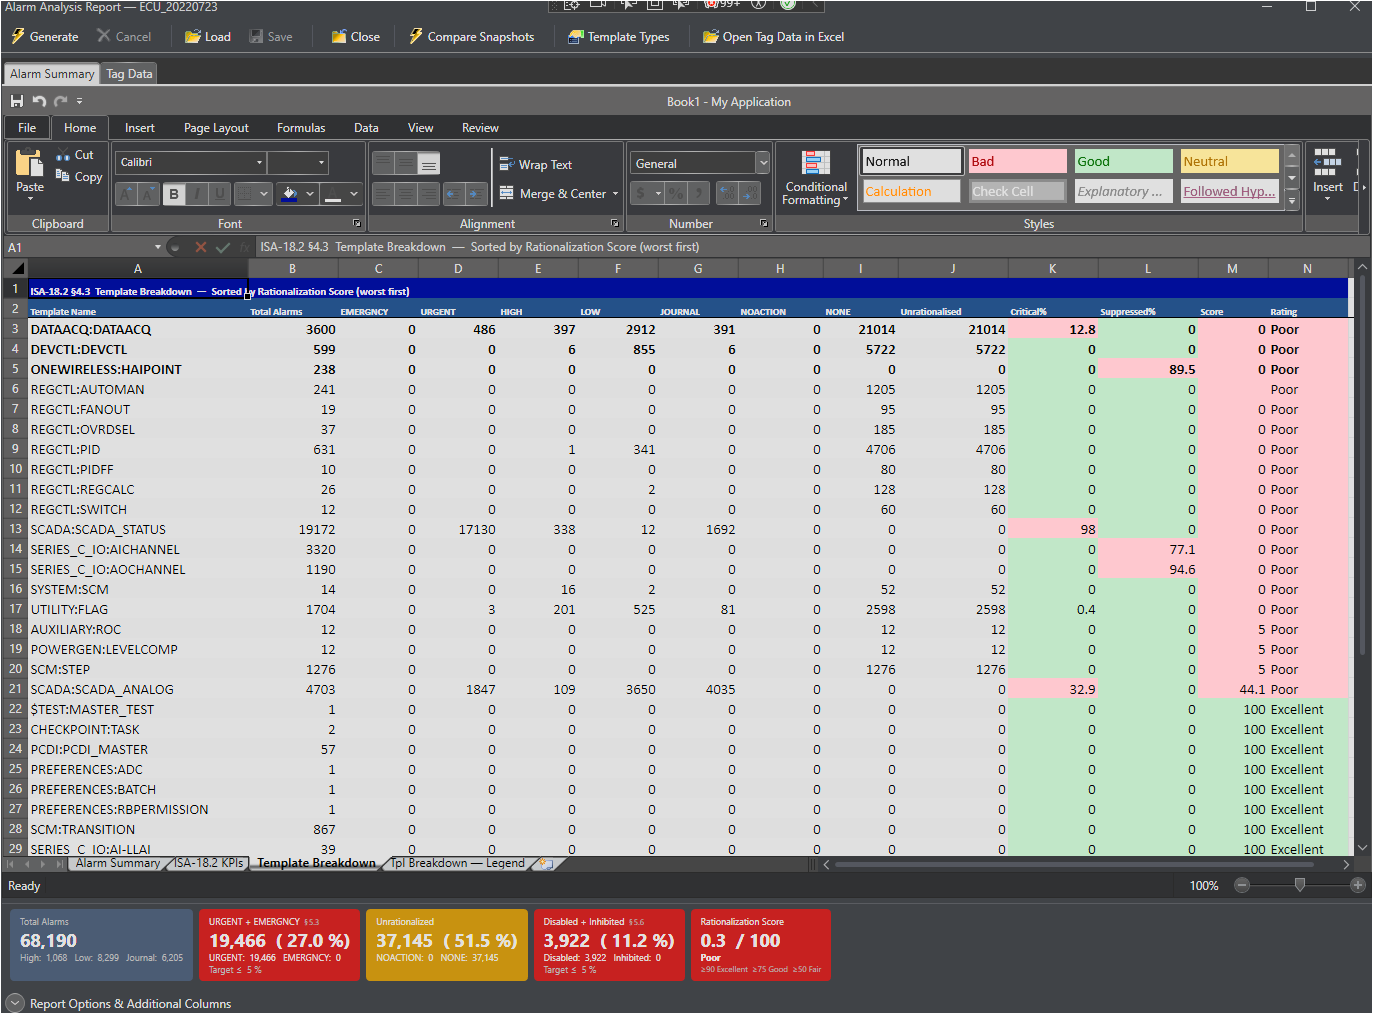
The Template Breakdown worksheet provides an ISA-18.2 §4.3 per-template offender ranking. It answers the question: "Which Control Architect templates are driving poor fleet-wide compliance metrics?"
Each row represents one unique TemplateName as it appears in the Tag Data worksheet, sorted worst-first by Rationalization Score. The three worst offenders are displayed in bold for immediate executive identification.
Column Definitions
Column
Header
Formula / Source
A
Template Name
The TemplateName property of the alarm block. Blocks with no template assignment appear as (No Template).
B
Total Alarms
Count of alarm block rows assigned to this template in the Tag Data worksheet.
C
EMERGNCY
Count of alarm parameters resolving to priority EMERGNCY for this template.
D
URGENT
Count of alarm parameters resolving to priority URGENT.
E
HIGH
Count of alarm parameters resolving to priority HIGH.
F
LOW
Count of alarm parameters resolving to priority LOW.
G
Unrationalized
Count of alarm parameters resolving to priority NOACTION or NONE. These alarms have not been assigned a rationalized priority and contribute directly to the Score penalty.
A Totals row is appended at the bottom of the data (below the last template row) and shows the fleet-wide sum for columns B through G:
Total Alarms — sum of all template alarm counts.
EMERGNCY, URGENT, HIGH, LOW, Unrationalized — fleet totals for each priority band.
Columns H–K (Critical%, Suppressed%, Score, Rating) are intentionally left blank in the Totals row because these are derived rates — a fleet-level sum is not meaningful. Use the Alarm Summary worksheet for fleet-wide rates.
Score Weighting Rationale
Weight
Dimension
ISA Reference
Rationale
× 2.0
Critical% (Priority)
§5.3
Highest safety impact — URGENT and EMERGNCY alarms demand operator response and directly affect safety case integrity.
× 1.5
Suppressed% (Suppression)
§5.6
Suppressed alarms mask process hazards and indicate nuisance alarm root causes that have not been resolved.
In the exported Excel file, each computed column header (H through K) has a cell comment that documents the full formula, threshold bands and ISA-18.2 reference. Hover over any column header cell to display the comment. The threshold values shown in the comments reflect the site-configured values at the time the report was exported.
Legend Worksheet
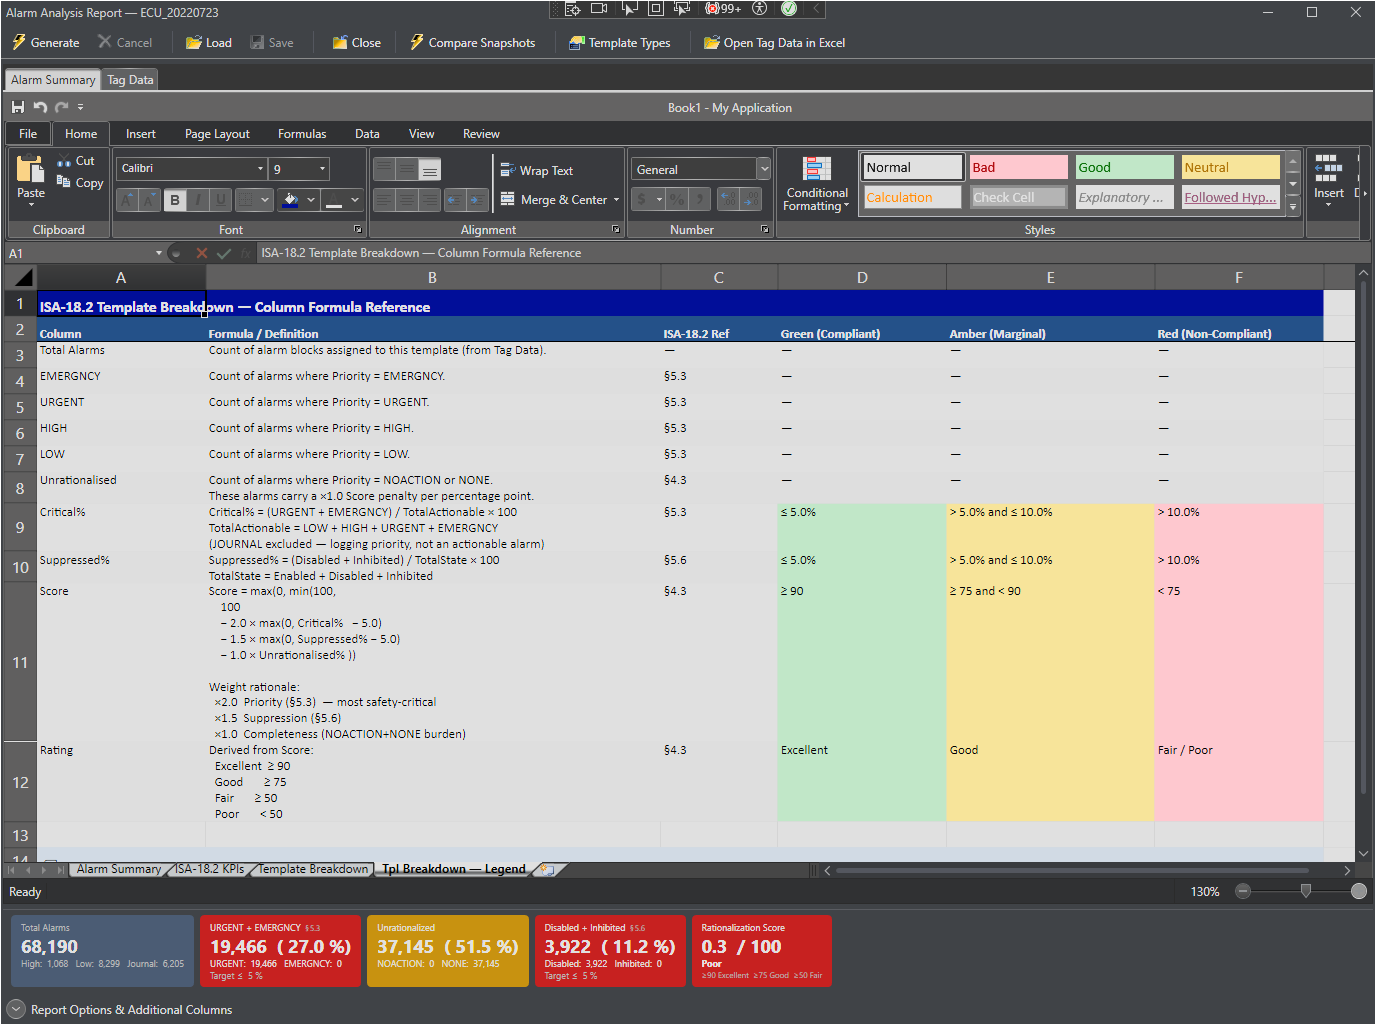
A companion Tpl Breakdown — Legend worksheet is always included alongside the Template Breakdown sheet. It provides a permanent, printable formula reference with color-coded threshold band cells. See Template Breakdown Legend.
Note — ISA Threshold Source The threshold value used in all formulas above is the ISA Compliance Threshold configured in Report Settings (default 5.0%). The same threshold is used consistently across the Alarm Summary, ISA-18.2 KPIs, and Template Breakdown worksheets.