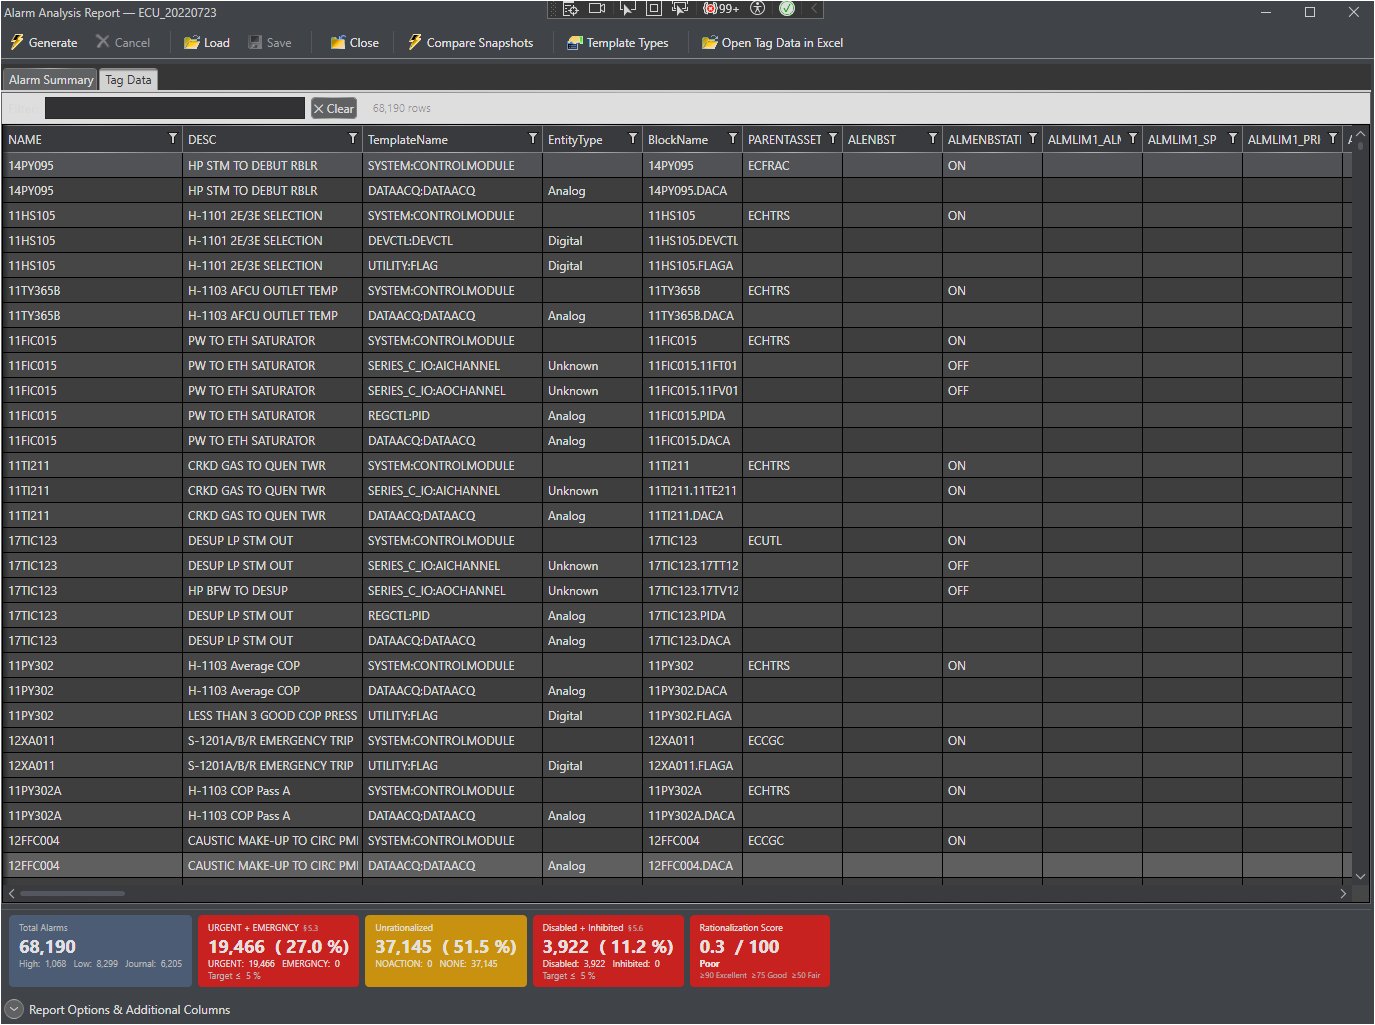
The Tag Data worksheet contains one row per alarm block for every entity processed in the active asset collection. It is the raw data foundation from which all summary counts and ISA-18.2 metrics are derived.
Note — Export Only The Tag Data worksheet is present in the exported Excel file only. It is intentionally excluded from the in-app spreadsheet viewer to prevent the multi-second layout delay that occurs when the Spreadsheet UI Control activates a sheet with 96+ columns and thousands of rows.
Column Structure
Columns are divided into two groups:
Identity Columns (always present)
Column
Parameter
Description
A
NAME
Entity name (the CM block / asset name).
B
DESC
Block description.
C
TemplateName
The Control Architect template assigned to the block. Used as the grouping key in the Template Breakdown worksheet.
D
BlockName
The name of the specific alarm block within the entity.
Alarm Parameter Columns
Starting at column E, every default alarm parameter is included. These cover:
Expression Parameters (.EXPR) — C[1] through C[10], SC, IC
Output Source Expressions (.SRCEXPR) — OP[1] through OP[12]
Re-alarm Options — $REALARM, REALARM, ALMOPT
State Alarm Parameters — STATE0 through STATE3 (enable state and priority)
Any Custom Parameters configured in Report Options are appended after the default columns in the order they were added. See Report Options & Custom Parameters.
Row Inclusion Rules
Not every block in every entity produces a Tag Data row. The rules are:
The CM block (index 0) of each entity always produces a row.
Embedded blocks produce a row only when they carry at least one non-empty alarm parameter value — blocks with no alarm data are skipped to keep the sheet concise.
NOACTION / NONE Row Highlighting
When the Highlight NOACTION / NONE rows option is enabled in Report Options, any Tag Data row where at least one alarm-relevant parameter equals NOACTION or NONE (case-insensitive) is filled with a light amber background in the exported Excel file.
This transforms the Tag Data sheet into a color-filtered rationalization checklist:
1. Open the exported Excel file.
2. In Excel, use Data → Filter then Filter by Color on any column to show only the amber rows.
3. Work through the highlighted rows to assign rationalized priority values.
Tip The highlight setting is applied at export time, not at generation time. This means you can toggle the setting and re-export without regenerating the full report. The stored MongoDB bytes are updated to reflect the current setting each time you export.
Numeric Value Handling
Cells containing numeric values (setpoints, trip points) are stored as numbers so Excel can perform arithmetic on them. Non-numeric strings are stored as text. Values of NaN, Infinity and -Infinity are suppressed (cell left blank) because Excel cannot store IEEE special float values. Expression parameters beginning with = have the leading equals sign stripped to prevent Excel from misinterpreting them as formula cells.