Understanding the Excel Report Layout
The Alarm Analysis Report generates a multi-worksheet Excel workbook containing structured alarm data, ISA-18.2 compliance metrics, and template rationalization scoring. This topic describes the layout and content of each worksheet.
|
Note: The console-scoped report also includes a Station Summary worksheet (see below) that is not present in the plant-wide report.
|
Workbook Structure
The generated workbook contains the following worksheets in order:
-
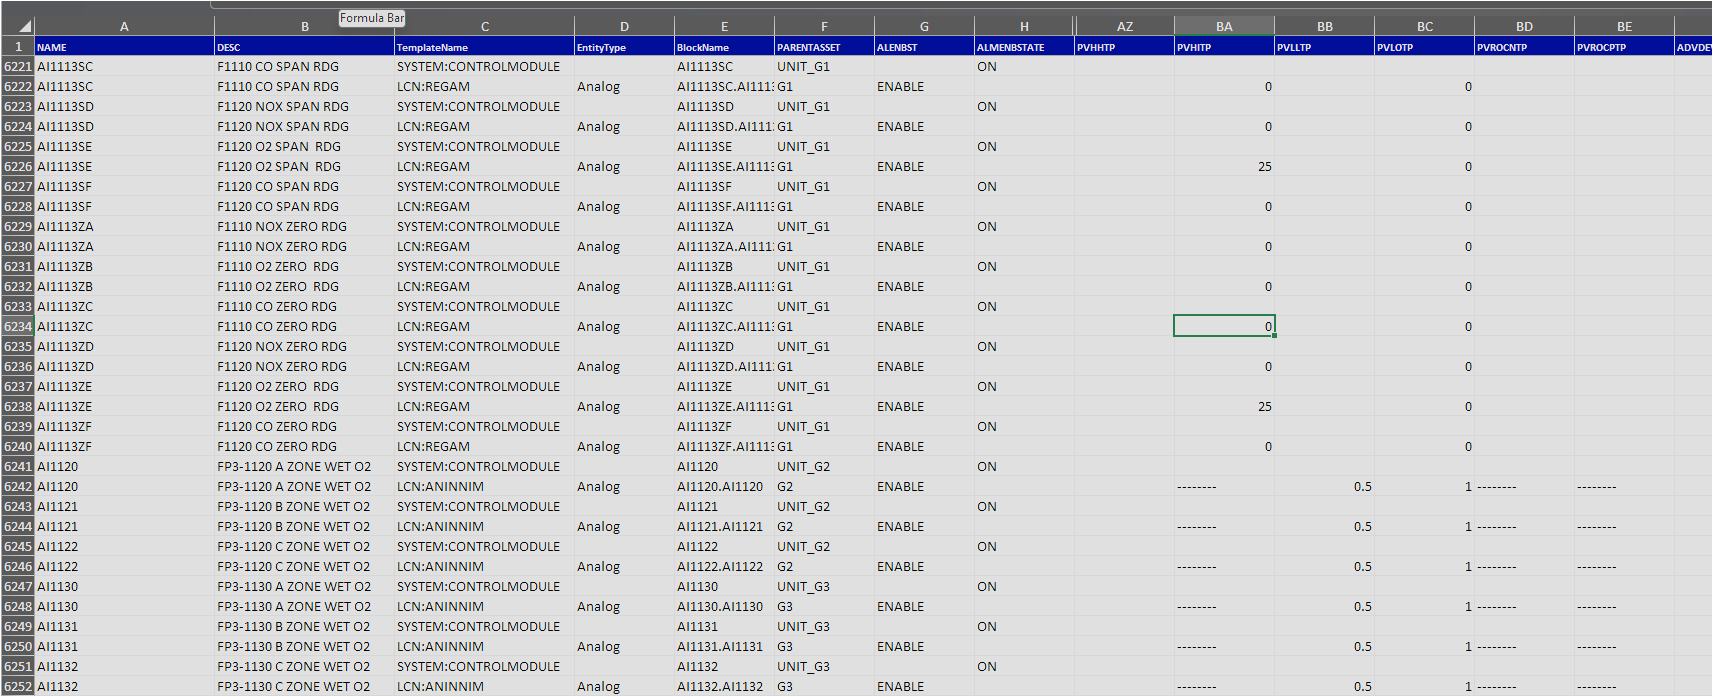
Tag Data — One row per alarm block entity; 96+ parameter columns
-
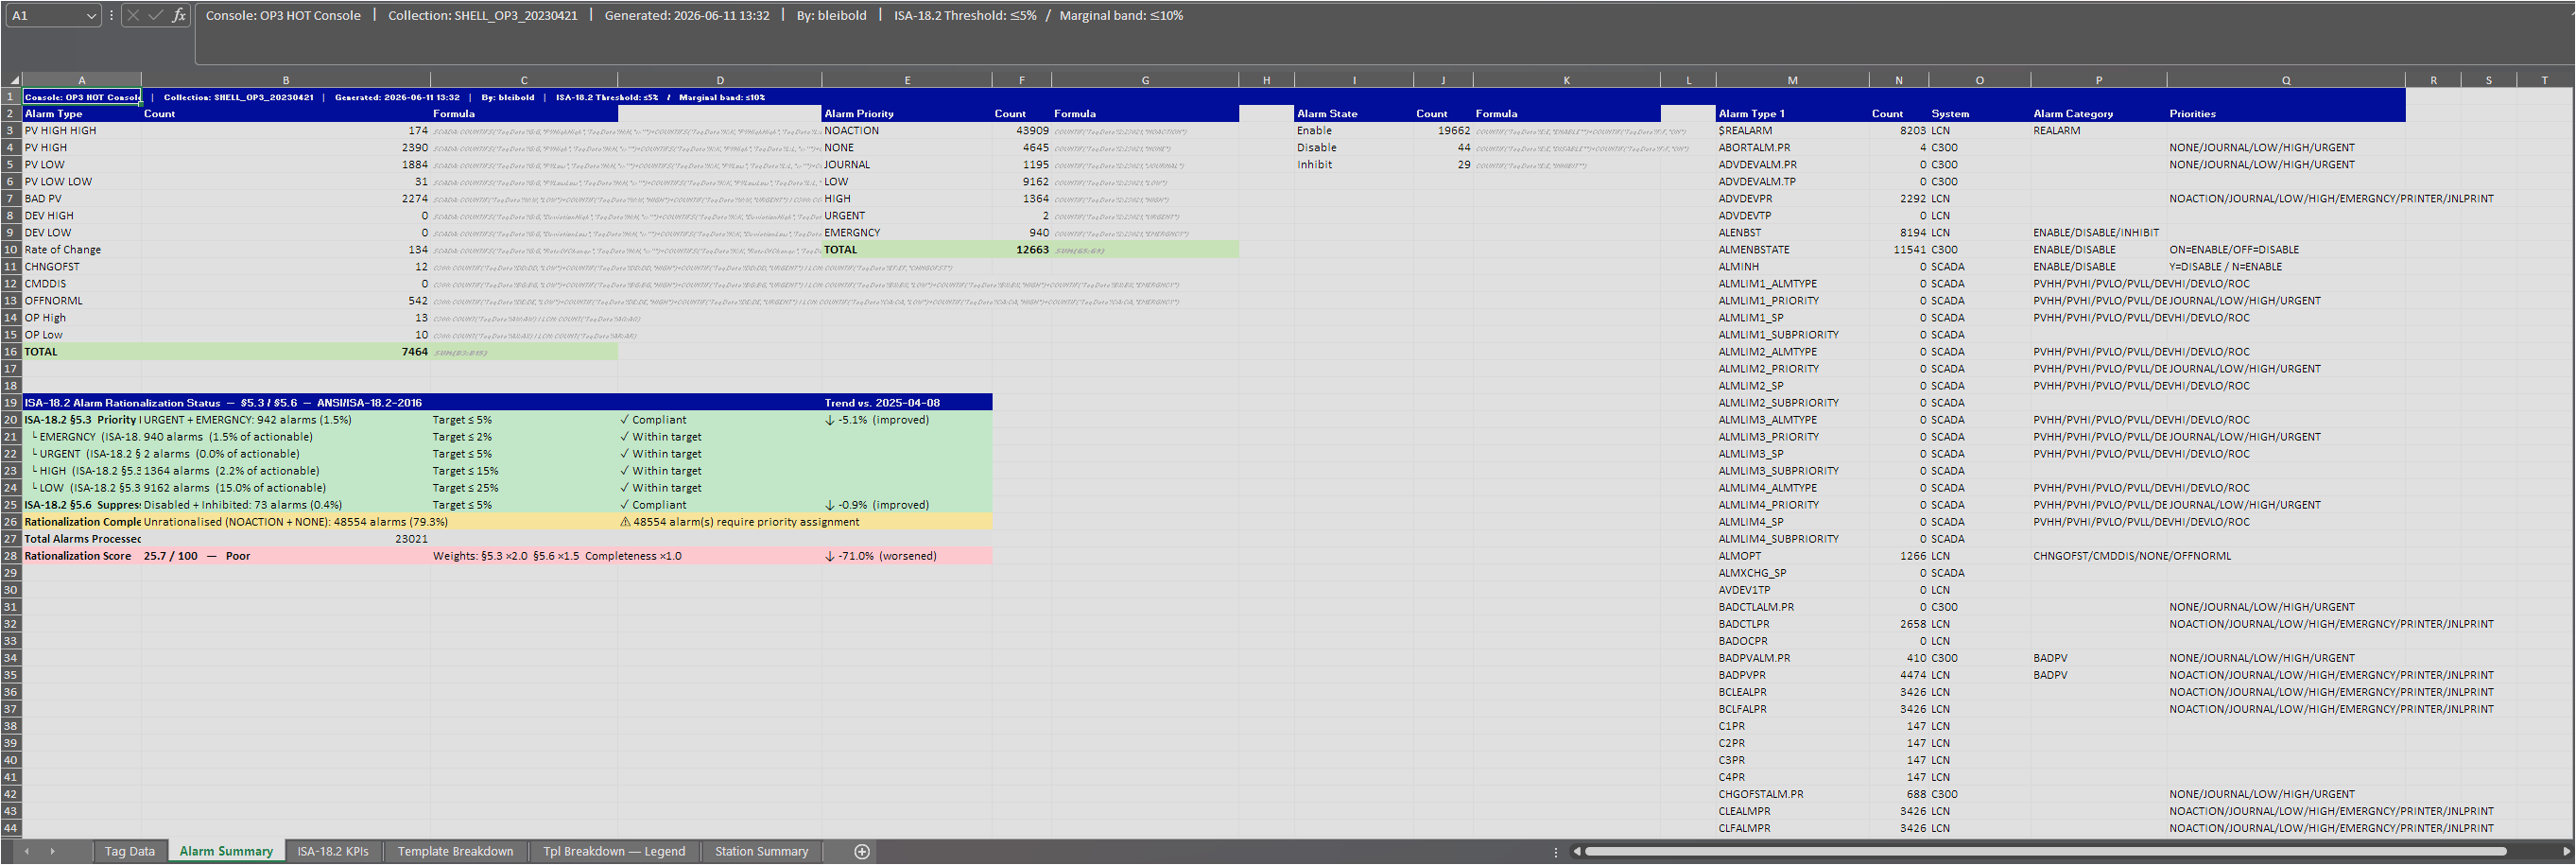
Alarm Summary — Alarm Type, Priority, and State counts with ISA-18.2 rationalization block
-
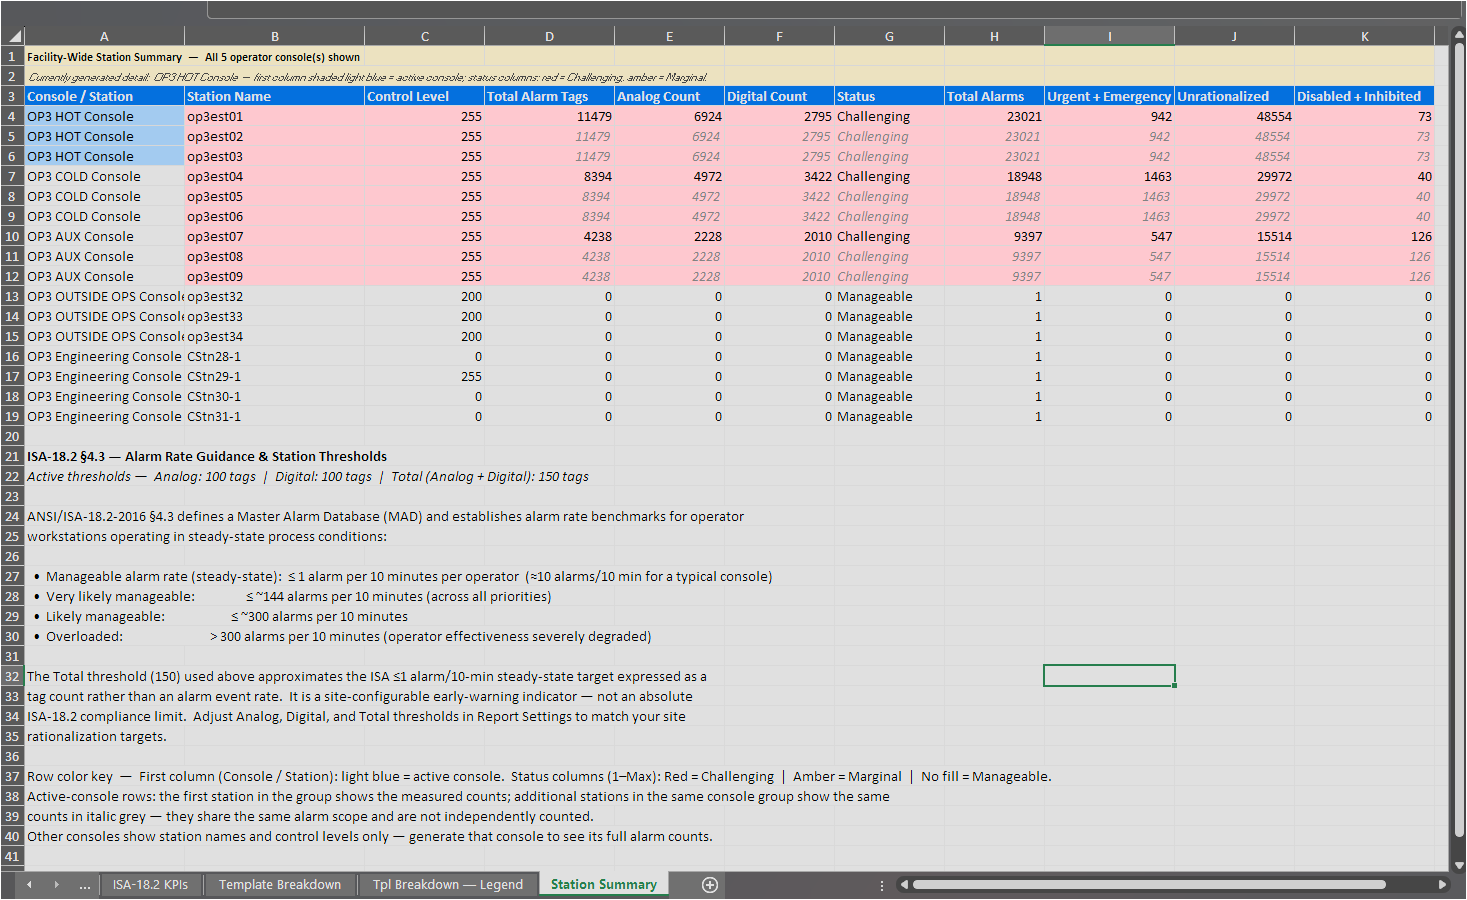
Station Summary — Per-station alarm counts with Manageable/Challenging status (console report only)
-
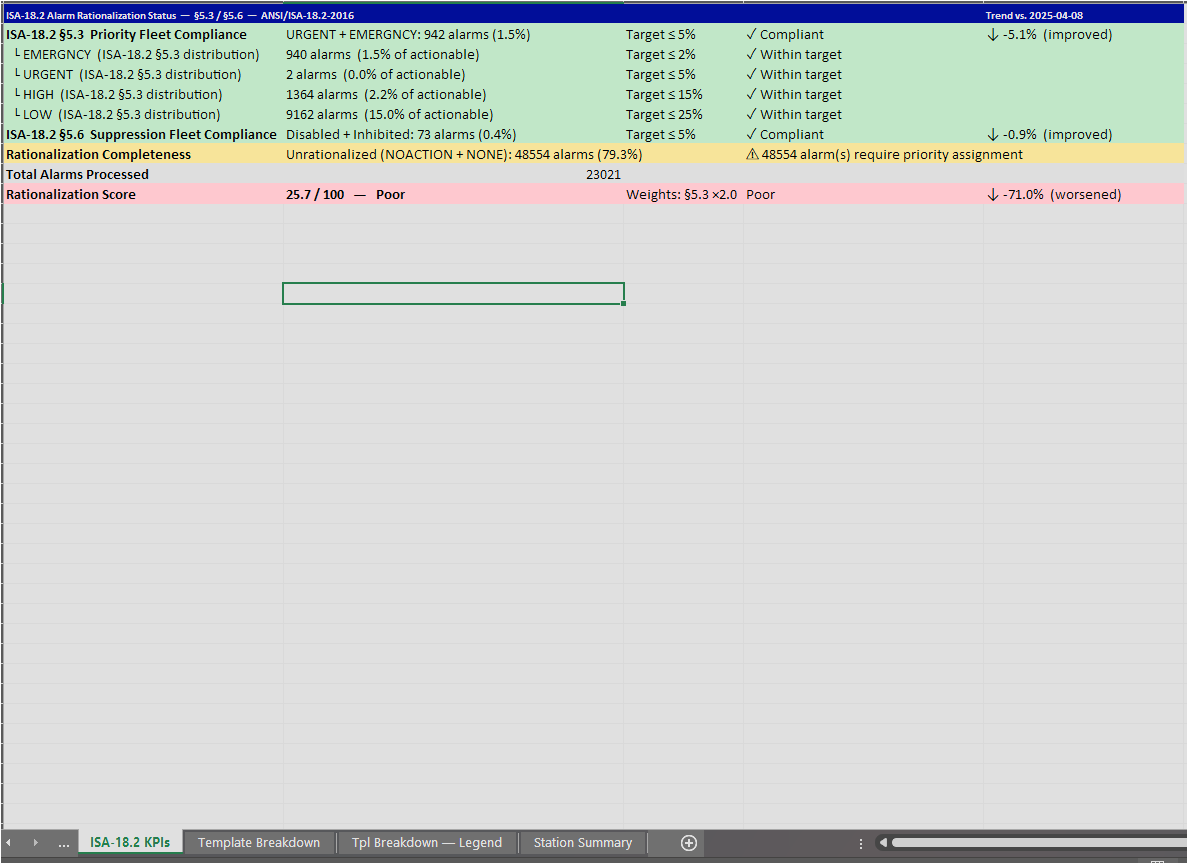
ISA-18.2 KPIs — §5.3 priority compliance, distribution benchmarks, §5.6 suppression, and overall score
-
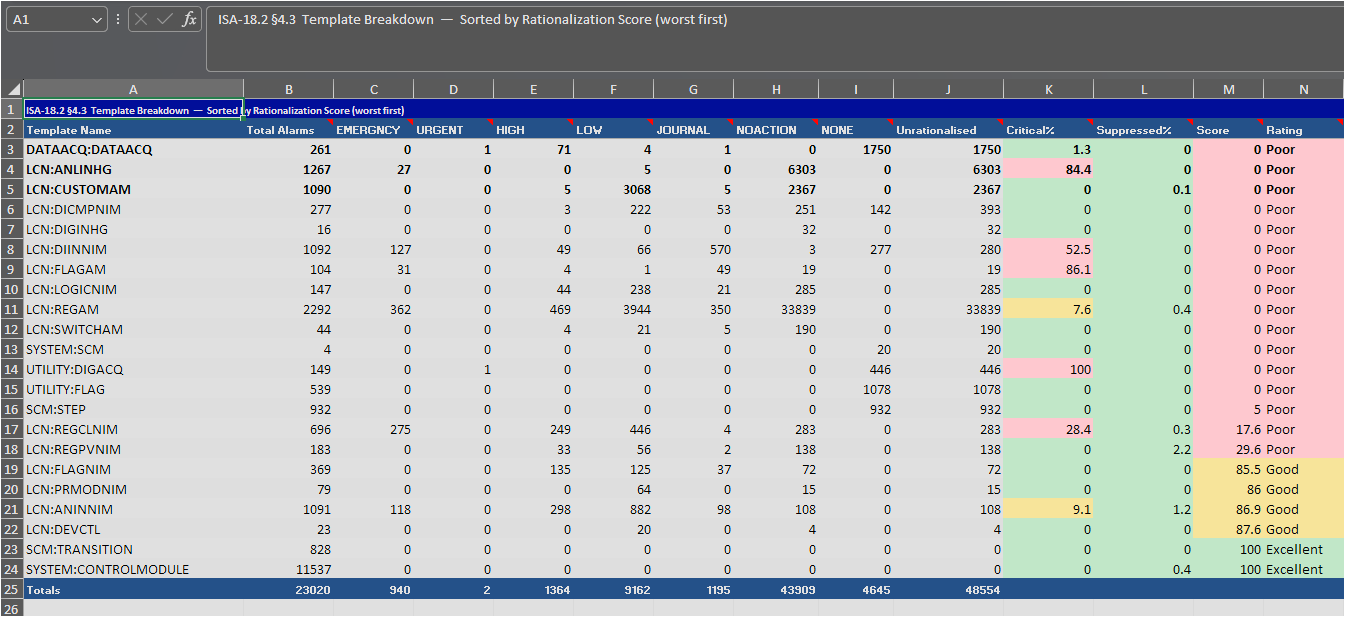
Template Breakdown — Per-template ISA-18.2 §4.3 analysis sorted worst-first by score
-
Tpl Breakdown — Legend — Column formula reference for the Template Breakdown sheet
Tag Data Worksheet
The Tag Data worksheet provides a detailed per-entity listing of every alarm block processed during report generation. It is the primary data source for all summary calculations and is intended for engineers performing detailed alarm rationalization work.
Identity Columns
|
Column
|
Description
|
|
NAME
|
The entity (CM/block) name
|
|
DESC
|
The entity description
|
|
TemplateName
|
The PKS block template name (e.g., PIDTPL, LOGIC_TPL)
|
|
EntityType
|
Analog or Digital — derived from the Template Classification editor
|
|
BlockName
|
The individual block name within the CM file
|
|
PARENTASSET
|
The process asset the entity belongs to. For Honeywell LCN entities this falls back to the UNIT parameter when PARENTASSET is absent.
|
|
Other Columns
|
Columns that represent Alarm type parameters.
|
Alarm Parameter Columns
Following the identity columns are 90+ alarm parameter columns covering alarm enable state, limit configuration, trip points, priorities, suppression, and state parameters. The default set is defined in Report Settings and can be extended with custom parameter names.
Row Highlighting
-
Light amber fill — Row contains a NOACTION or NONE priority value (unrationalized alarm). Enabled via the Highlight Unrationalized Rows setting.
-
Darker amber fill — Row's block template is not present in the Template Classification list (unknown entity type).
|
Tip: Use Excel's Filter by Color feature on Tag Data to quickly find all unrationalized rows or rows with unclassified templates.
|
Alarm Summary Worksheet
The Alarm Summary worksheet provides fleet-level alarm counts and an ISA-18.2 rationalization block. It is intended for management review and alarm rationalization workshop presentations.
Report Header
-
-
Console Scope — Operator console name, or blank for plant-wide reports
-
Collection Name — The Configuration Collection analyzed
-
Alarm Type Counts
A table listing each alarm type (e.g., PVHIALM, PVLOALM, DEVHIALM, ALMOPT, STATE.ALMENBST) with its total count across all Tag Data rows.
Alarm Priority Counts
A table showing how many alarm-relevant parameter values carry each priority level (CRITICAL, URGENT, HIGH, LOW, JOURNAL, NOACTION, NONE, etc.).
Alarm State Counts
A table with three rows: Enabled, Disabled, and Inhibited alarm counts derived from the ALENBST and ALMENBSTATE parameters.
ISA-18.2 Rationalization Block
Below the count tables, the sheet includes an ISA-18.2 §5.3 compliance summary showing trend indicators (↑↓→) relative to the most recent snapshot from a previous collection.
Station Summary Worksheet (Console Views Only)
The Station Summary worksheet appears only in console-scoped reports. It provides a facility-wide view: every operator console defined in the Console Mapping is listed, not just the one selected for the current generation run. This allows a single worksheet to show the alarm loading of the entire facility, with the currently generated console visually distinguished from the others.
Counts are accumulated incrementally — each time a console is generated its station stats are saved to MongoDB. When the next console is generated, all previously saved stats are loaded and merged into the sheet. Generate each console in sequence to build the complete facility view.
Column Layout
|
Column
|
Description
|
|
Console / Station
|
The operator console name and station identifier
|
|
Station Name
|
The descriptive station name as read from crtdmp.txt
|
|
Control Level
|
The station control level from the console dump file
|
|
Total Alarm Tags
|
Count of Tag Data rows whose PARENTASSET (or UNIT) maps to an asset visible from this station
|
|
Analog Alarm Count
|
Subset of Total where EntityType = Analog
|
|
Digital Alarm Count
|
Subset of Total where EntityType = Digital
|
|
Status
|
Manageable, Marginal, or Challenging — determined by the configurable thresholds in Report Settings. Shown only for the active console's stations.
|
|
Total Alarms
|
Total number of alarm blocks within this console's alarm scope as computed by the rationalization analysis. This is the ISA-18.2 population figure — it includes every
alarm parameter that carries a priority value (JOURNAL, LOW, HIGH, URGENT, EMERGNCY, NOACTION, NONE).
Console-scoped: the value is identical across every station row that belongs to the same console group. For the currently active console it reflects the live report run; for all other consoles it is retrieved from the persisted cache produced during their last report generation. Displays '—' if no cached data is available for that console yet.
|
|
Urgent + Emergency
|
Combined count of URGENT and EMERGNCY priority alarms within the console's alarm scope. This is the ISA-18.2 §5.3 numerator — the figure used to determine whether the console exceeds the critical-alarm percentage target (default ≤ 5% of total actionable alarms).
Console-scoped: identical for every station row in the console group. Displays '—' if no cached data is available.
|
|
Unrationalized
|
Count of alarms assigned a priority of NOACTION or NONE — alarms that have not yet been given a rationalized priority designation. A non-zero value indicates incomplete rationalization work remaining for this console's alarm scope.
Console-scoped: identical for every station row in the console group. Displays '—' if no cached data is available.
|
|
Disabled + Inhibited
|
Combined count of alarms currently in the Disable or Inhibit state within the console's alarm scope. This is the ISA-18.2 §5.6 numerator — the figure used to determine whether the console's alarm suppression level exceeds the target (default ≤ 5% of total configured alarms).
Console-scoped: identical for every station row in the console group. Displays '—' if no cached data is available.
|
Row Highlighting
-
Light blue fill — Rows belonging to the active (currently generated) console. The Status column is populated for these rows.
-
Green fill — Active console station: Status = Manageable (all counts below their thresholds)
-
Amber fill — Active console station: Marginal (total count within 20% of the Total threshold)
-
Red fill — Active console station: Status = Challenging (a count exceeds its threshold)
-
Gray fill — Rows belonging to other consoles that have not yet been generated; count columns show a dash (—).
|
Note: If another console's rows show a dash in the count columns, that console has not yet been generated. Generate that console to populate its station counts in future reports.
|
Thresholds
The thresholds used for station classification are configured in the Station Summary Thresholds (ISA-18.2 §4.3) section of Report Options:
-
Analog Alarm Threshold — default 100 (ISA-18.2 §4.3 guidance)
-
Digital Alarm Threshold — default 100
-
Total Alarm Threshold — default 150 (ISA-18.2 §4.3 steady-state manageable rate)
ISA-18.2 KPIs Worksheet
The ISA-18.2 KPIs worksheet presents structured compliance metrics aligned with the ANSI/ISA-18.2-2016 standard.
Sections
-
§5.3 Priority Distribution — Percentage of alarms in each priority level; green/amber/red compliance banding against the configured ISA threshold (default 5% for Critical/Urgent/High combined).
-
§5.3 Priority Compliance Score — Overall percentage of alarms in the three highest-priority levels versus the total alarm population.
-
§5.6 Suppression Metrics — Disabled and Inhibited alarm counts and their percentage of the total alarm population.
-
Trend Indicators — ↑↓→ arrows comparing the current report against the most recent snapshot saved from a previous collection.
Template Breakdown Worksheet
The Template Breakdown worksheet provides a per-template ISA-18.2 §4.3 rationalization analysis, sorted worst-first by the template's overall health score. Each row represents one distinct block template found in the Tag Data.
Key Columns
|
Column
|
Description
|
|
Template Name
|
The block template identifier
|
|
Entity Type
|
Analog or Digital classification
|
|
Total Tags
|
Number of alarm tags using this template
|
|
Unrationalized
|
Count of tags with NOACTION or NONE priority
|
|
% Rationalized
|
Percentage of tags with a defined priority
|
|
Health Score
|
Composite ISA-18.2 §4.3 score for this template
|
Using the Report for Analysis
Sorting and Filtering
All worksheets support Excel's native sorting and filtering. Use filter drop-downs to focus on specific stations, statuses, or alarm types. The EntityType column in Tag Data can be filtered to show only Analog or Digital alarms.
Pivot Tables
The Tag Data worksheet can be used as a data source for Excel pivot tables. Common analyses include alarm count by Block Template, alarm count by Entity Type, and alarm parameter usage statistics.
See Also