Snapshot Comparison View
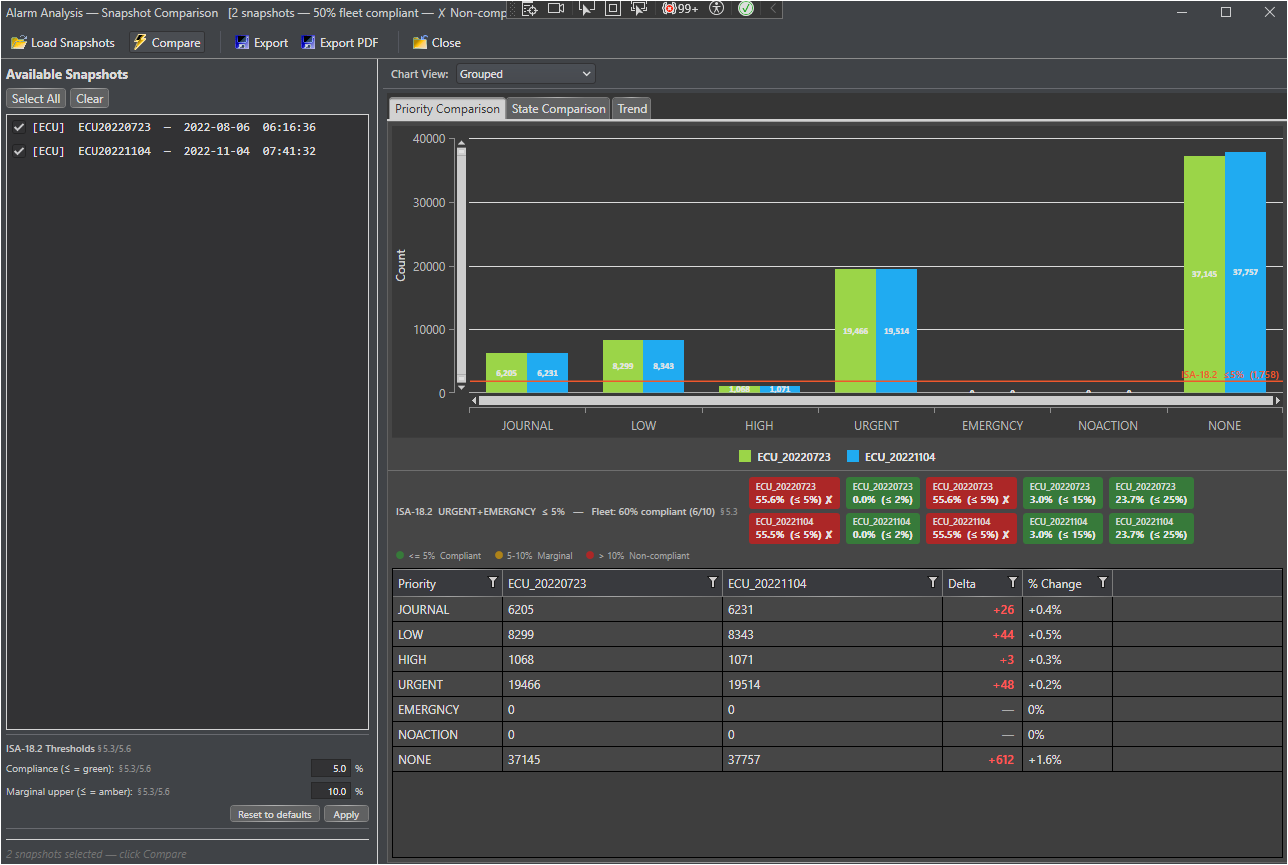
The Snapshot Comparison View is a dedicated analysis window that lets engineers select two or more saved alarm analysis snapshots, compare them side-by-side across alarm priority and state dimensions, and evaluate ISA-18.2 compliance trends over time. Two variants of the view exist:
-
Unit-Wide Alarm Comparison — compares snapshots captured across the entire asset collection (all alarms, all consoles combined).
-
Console Alarm Comparison — compares snapshots scoped to a single selected console. See Console Snapshot Comparison for the console-specific differences.
Both views share identical layout, tab structure, ISA-18.2 KPI badges, threshold controls, and export functions. The sections below cover all features applicable to both variants.
Prerequisite At least two alarm analysis reports must have been generated (and therefore saved as snapshots to MongoDB) before the Comparison View has data to work with. See Trend Analysis and Snapshots.
|
Window Layout
The window is divided into three main areas:
|
Area
|
Description
|
|
Toolbar
|
Commands for loading snapshots, running a comparison, exporting results, and closing the window. The Console variant also includes a Console selector drop-down here.
|
|
Left panel — Snapshot List
|
A scrollable checkbox list of all snapshots found in MongoDB, ordered by date. Contains Select All / Clear buttons, the ISA-18.2 threshold editor, and a selection status line at the bottom.
|
|
Right panel — Comparison Tabs
|
Three tabs — Priority Comparison, State Comparison, and Trend — each containing a bar or line chart, ISA-18.2 KPI compliance badges, and a detailed data grid.
|
A resizable splitter between the left and right panels lets you give more screen space to the chart area when many snapshots are selected.
Toolbar Commands
|
Button
|
Enabled when
|
Action
|
|
Load Snapshots
|
Always
|
Queries MongoDB for all saved alarm analysis snapshots and populates the left-panel checkbox list. The view auto-loads snapshots on first open.
|
|
Compare
|
2 or more snapshots selected
|
Builds all comparison tables, chart series, ISA-18.2 KPI badges, and the Trend chart from the selected snapshots. Updates the window title bar with a fleet compliance summary.
|
|
Export
|
After Compare has been run
|
Saves the Priority and State comparison tables to an Excel workbook (.xlsx) or CSV file. Excel exports are opened automatically after saving; the containing folder is revealed in Windows Explorer.
|
|
Export PDF
|
After Compare has been run
|
Exports the ISA-18.2 §5.3/§5.6 KPI trend data to a standalone PDF report containing compliance tables, the Trend chart image, and a fleet summary.
|
|
Close
|
Always
|
Closes the Snapshot Comparison window.
|
Snapshot List (Left Panel)
Selecting Snapshots
Each row in the checkbox list represents one saved snapshot. Check the rows you wish to include in the comparison — a minimum of two is required before the Compare button becomes active. The selection status line at the bottom of the panel updates in real time:
-
Select 2 or more snapshots to compare — nothing selected.
-
Select at least 1 more snapshot to compare — only one selected.
-
N snapshots selected — click Compare — ready to run.
Use Select All to check all available snapshots at once, or Clear to uncheck everything. Hover over any snapshot row to see its full metadata (capture date, collection name, database, and optional description) in a tooltip.
|
Snapshot Order Snapshots are always processed in chronological order (oldest first) regardless of the order they appear in the list. The Delta column in each grid is always current − previous reading from left to right.
|
ISA-18.2 Threshold Editor
The threshold editor appears at the bottom of the left panel and controls how the ISA-18.2 compliance color bands are calculated across all badges and charts.
|
Field
|
Default
|
Applied to
|
|
Compliance (≤ = green)
|
5.0%
|
§5.3 URGENT+EMERGNCY combined as % of total actionable alarms.
§5.6 Disabled+Inhibited as % of all configured alarms.
Values at or below this threshold are shown in green.
|
|
Marginal upper (≤ = amber)
|
10.0%
|
Values exceeding the compliance threshold but at or below this limit are shown in amber. Values above this limit are shown in red. Must exceed the compliance threshold.
|
Click Apply to validate, persist the new thresholds to MongoDB, and immediately refresh all charts and badges without needing to click Compare again. Click Reset to defaults to restore the ANSI/ISA-18.2-2016 standard values (5% compliance, 10% marginal) and apply them automatically.
|
Validation Rules The compliance threshold must be between 0% and 100%. The marginal upper limit must be strictly greater than the compliance threshold and less than 100%. An inline validation message appears in orange-red if either rule is violated — thresholds are not committed until both fields pass.
|
Priority Comparison Tab
Bar Chart
The priority bar chart shows alarm counts for each of the seven priority categories (JOURNAL, LOW, HIGH, URGENT, EMERGNCY, NOACTION, NONE) across every selected snapshot. Use the Chart View dropdown above the tab area to choose from four display modes:
|
Mode
|
Description
|
|
Grouped
|
One cluster of bars per priority label; each snapshot is a separate bar within the cluster. Best for directly comparing like-for-like counts.
|
|
Stacked
|
Bars stacked vertically so the combined total height shows the overall alarm count per snapshot.
|
|
Horizontal
|
Same as Grouped but rotated 90° — useful when many snapshots are selected and labels overlap.
|
|
Normalized (% share)
|
Each bar is scaled to 100% so only the proportional distribution of priorities is shown, independent of total count. Ideal for detecting shifts in alarm priority profile.
|
The chart supports vertical pan and zoom — scroll the mouse wheel to zoom vertically, or drag to zoom a region. Right-click to reset the zoom.
ISA-18.2 §5.3 Compliance Badges
Below the chart legend, a strip of colored badge pills provides an at-a-glance ISA-18.2 §5.3 compliance assessment for every selected snapshot. Five badge types are shown per snapshot:
|
Badge
|
ISA-18.2 Target
|
Calculation
|
|
URGENT + EMERGNCY
|
≤ 5% (site-configurable)
|
(URGENT + EMERGNCY) ÷ (JOURNAL + LOW + HIGH + URGENT + EMERGNCY) × 100
|
|
EMERGNCY (dist.)
|
≤ 2%
|
EMERGNCY ÷ total actionable × 100
|
|
URGENT (dist.)
|
≤ 5%
|
URGENT ÷ total actionable × 100
|
|
HIGH (dist.)
|
≤ 15%
|
HIGH ÷ total actionable × 100
|
|
LOW (dist.)
|
≤ 25%
|
LOW ÷ total actionable × 100
|
Each badge is color-coded using the three-band ISA-18.2 convention:
|
Color
|
Meaning
|
|
Green
|
Compliant — at or below the target threshold.
|
|
Amber
|
Marginal — above the threshold but within the early-warning band (≤ 2× target for distribution KPIs; ≤ marginal setting for the combined KPI).
|
|
Red
|
Non-compliant — exceeds the marginal band.
|
Hover over any badge to see a tooltip with the metric name, snapshot label, computed percentage value, ISA-18.2 section and target, and a color key legend.
The badge strip header updates after each Compare run to show the fleet-level summary, for example:
|
ISA-18.2 URGENT+EMERGNCY ≤ 5% — Fleet: 60% compliant (6/10)
|
Priority Comparison Grid
Below the chart, a data grid shows one row per priority label with one column per selected snapshot. An additional Delta column appears between each pair of consecutive snapshots showing the change in alarm count:
-
Red — count increased (more alarms — worsening).
-
Green — count decreased (fewer alarms — improving).
-
Gray — no change between snapshots.
Hover over any Delta cell for a full explanation of the color coding.
Click a row to highlight the corresponding bar(s) on the chart.
State Comparison Tab
The State Comparison tab mirrors the Priority tab but operates on alarm state data (Enable, Disable, Inhibit) and applies the ISA-18.2 §5.6 suppression metric.
ISA-18.2 §5.6 Compliance Badge
One badge per snapshot is shown in the State badge strip:
|
Badge
|
ISA-18.2 Target
|
Calculation
|
|
Disabled + Inhibited
|
≤ 5% (site-configurable)
|
(Disable + Inhibit) ÷ (Enable + Disable + Inhibit) × 100
|
The same color-coding rules (green / amber / red) apply, using the site-configurable thresholds from the ISA-18.2 Threshold Editor.
State Comparison Grid
The grid shows Enable, Disable, and Inhibit counts per snapshot with Delta columns between consecutive snapshots, using the same red/green/gray color scheme as the Priority grid.
Trend Tab
The Trend tab shows a time-series line chart plotting the count of each alarm priority category over the selected snapshots, with date on the horizontal axis (formatted yyyy-MM-dd). Two additional series are always included when data is present:
|
Series
|
Description
|
|
URGENT+EMERGNCY (combined)
|
The sum of URGENT and EMERGNCY alarm counts at each snapshot date. Plotted alongside the individual priority series so the aggregated critical-alarm total can be compared directly against the §5.3 threshold line.
|
|
Rationalization Score
|
The composite ISA-18.2 rationalization score (0–100) at each snapshot, providing a single trend indicator of overall alarm rationalization progress.
|
|
ISA-18.2 5% threshold (dashed)
|
A dashed reference line at Y = 5% of the total actionable alarm count at each snapshot date. When the URGENT+EMERGNCY series stays below this line, the fleet is §5.3-compliant.
|
The Trend chart supports vertical zoom (mouse wheel) and drag-to-zoom. A legend below the chart identifies each series by name and color.
|
Best Use Select all available snapshots and switch to the Trend tab to get the broadest view of alarm rationalization progress over time. The URGENT+EMERGNCY combined series versus the dashed threshold line is the most actionable ISA-18.2 indicator on this chart.
|
Window Title Bar — Fleet Compliance Summary
After every Compare run, the window title bar updates to show a fleet-level ISA-18.2 compliance summary derived from all Priority and State KPI assessments combined:
|
Alarm Analysis — Snapshot Comparison [N snapshots — XX% fleet compliant — ✓ Fully Compliant]
|
The status indicator uses the following logic:
|
Indicator
|
Condition
|
|
✓ Fully Compliant
|
Every KPI assessment across all selected snapshots and both metrics is green.
|
|
⚠ Marginal
|
No assessment is red, but at least one is amber.
|
|
✗ Non-compliant
|
At least one assessment is red (exceeds the marginal band).
|
This means you can monitor the overall fleet ISA-18.2 status at a glance from the Windows taskbar without switching between tabs.
Exporting Results
Export to Excel or CSV
Click Export (enabled after Compare has been run) to save the Priority and State comparison tables. A Save dialog prompts for a file name and format:
-
Excel Workbook (.xlsx) — multi-sheet workbook with Priority and State tables on separate sheets. The workbook is opened automatically in Excel after saving, and the containing folder is revealed in Windows Explorer.
-
CSV File (.csv) — comma-separated values suitable for import into other analysis tools.
The default file name includes a timestamp: AlarmSnapshotComparison_yyyyMMdd_HHmmss.xlsx.
Export PDF — ISA-18.2 KPI Trend Report
Click Export PDF (enabled after Compare has been run) to generate a standalone PDF containing:
-
ISA-18.2 §5.3/§5.6 compliance tables for all selected snapshots.
-
A chart image of the KPI trend over time.
-
A fleet compliance summary with snapshot count, overall pass rate, and threshold values.
The PDF is opened automatically after creation. It can be attached directly to a management review or HAZOP follow-up package.
Where to Go Next